
Excel spreadsheets are an essential tool for business users, but many are missing out on the power of Excel tables. While data is typically entered into cells in a tabular format, the use of table formatting is often overlooked, resulting in less productivity.
Excel tables provide a structured way to organize and manage data within a spreadsheet, offering numerous benefits, including an easier integration with Power Automate. By understanding how to leverage tables effectively, users can optimize their data management processes and enhance their overall workflow.
This is the first article from a series where we will be understanding how to integrate Excel tables and Power Automate, investigating how extract the maximum value from this connection. In this first post, we will delve into the concept of Excel tables, explore their advantages over traditional cell-based data organization and how to integrate it into Power Automate.
Other articles from this series
- Reading data from Excel tables with Power Automate
- Inserting and Updating data into Excel tables with Power Automate
Understanding the Excel Tables
In general, business users just enter data into Excel Spreadsheets cells, organizing it in a tabular layout and applying some formulas when needed. Even that sometimes these Spreadsheets have different visual formats, the use of a “table formatting” is not so frequent across the companies, and they’re losing productivity because of that.
Excel Tables are a structured way to organize and manage data within a spreadsheet. The Tables are identified as a separated entity by the Excel Application, allowing it to interact with the data without necessarily declare the used cells. For VBA purposes, for example, you can either interact with singular cells and ranges (this what generally occurs, as the business users trend to not format ranges as tables), or interact directly with a table entity, easily iterating each row, accessing details about the totals, and applying calculations. The same is valid for Office Scripts, which is the “VBA of Excel Online” (read more about this tool in this post).
In practice, when formatting your data as a table, you are expressly telling Excel that those spreadsheet ranges have a relationship, where each row represents an individual record and each column a dimension or property for the records.
In Power Automate, you also can work with tables or individual cells, but the interaction with a table entity will make your life much easier. For example, if you want to add a new record at the end of a dataset not formatted as table, you will need (1) to identify the last used row, (2) capture the index of the next empty row, (3) insert the record and (4) make sure that you repeat the same process if you need to add another record. If you use the table entity, your only task is to make sure that you are accessing the correct table: the record is by default inserted to the first empty row, being irrelevant how many occupied rows does the file have.
Creating a table in Excel
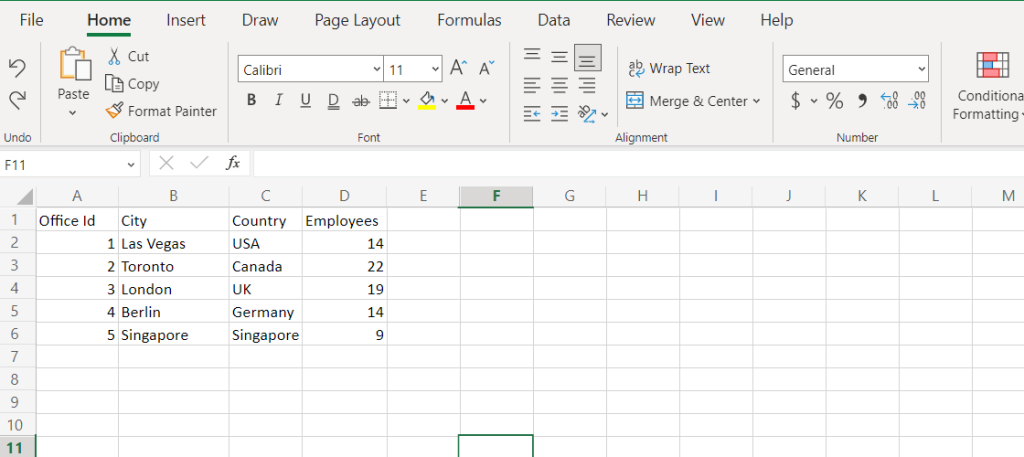
This is an example of a typical spreadsheet used by businesses. The columns usually represent categories and each row represents a new record. For design purposes, sometimes the column titles will be bolded, in other cases some cells will be merged, but, at the end of the day, we have a bunch of cells visually (but not logically) organized:
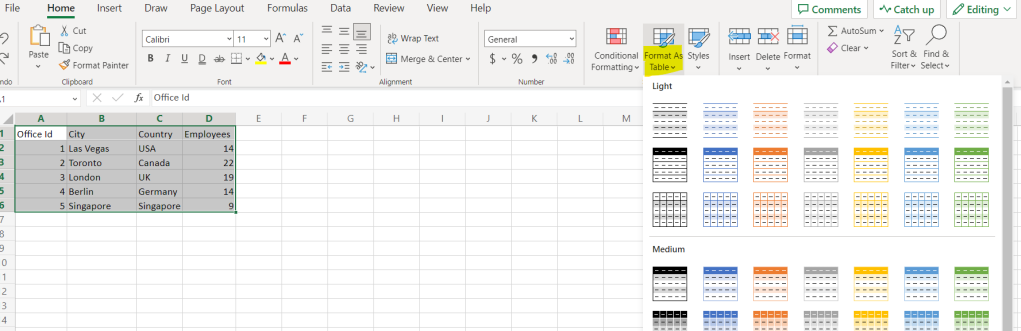
Transforming these cells into a table is very simple: select the range that must become a table, click in “Format As Table” in the ribbon (Home tab and Styles section) and select the desired style:
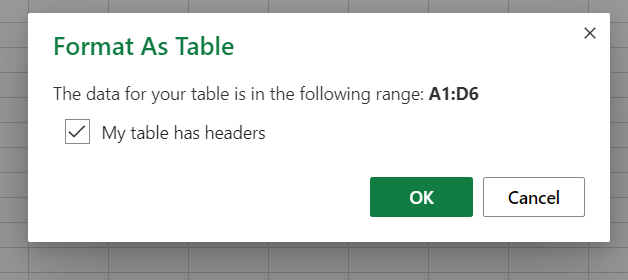
Excel will ask if your table has headers (the top used row of your sheet, where you usually describe the name of the column/property of your data), and after that will not only apply the selected style to your range, but also transform it into a table entity.
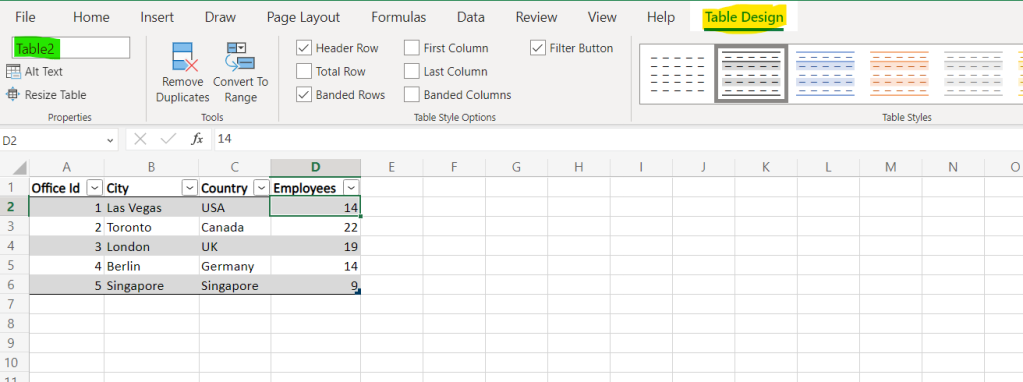
You can easily identify a table by just clicking in any of its fields: if the tab “Table Design” is visible on the ribbon, so you have a table (highlighted in yellow). In this tab, you will find some details about the table, like its name (highlighted in green), which is used to reference the entity in some Microsoft Features, like VBA, Office Scripts and Power Automate. You can change the name, just make sure to not have 2 tables with the same name and to not include blank spaces on it.
We will change the table name to “Office_List” and use this entity for the examples along this article series.
Integrating Excel and Power Automate
Power Automate provides a wide range of connectors that allow you to integrate and automate tasks between different applications and services. Connectors act as bridges, enabling seamless communication and data exchange between various systems. Currently, the Microsoft Power Platform (which includes Power Automate) has more than 1,000 connectors.
Some of these connectors are built-in, including those for popular applications like Microsoft Office 365 (such as SharePoint, Outlook, Excel, and Teams), social media platforms (such as Twitter and Facebook), cloud storage services (like OneDrive, Dropbox, and Google Drive), customer relationship management (CRM) systems (such as Salesforce and Dynamics 365), and many more.
Each connector has its own set of actions and triggers, allowing you to perform tasks or operations within that application (actions), such as creating a new file in OneDrive or sending an email in Outlook. Triggers, on the other hand, are events or conditions that initiate a flow, such as a new email arriving in your inbox (from Outlook connector) or a new record being added to a CRM system.
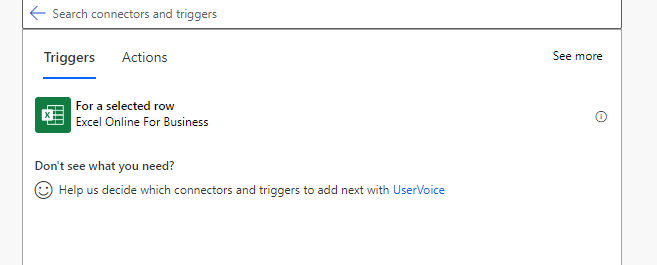
Excel has also a connector with Power Automate, allowing the user to capture events from Excel to trigger a flow, or perform action inside Excel files inside workflows (not necessarily triggered by the same application). Currently, Excel connector has only one trigger:
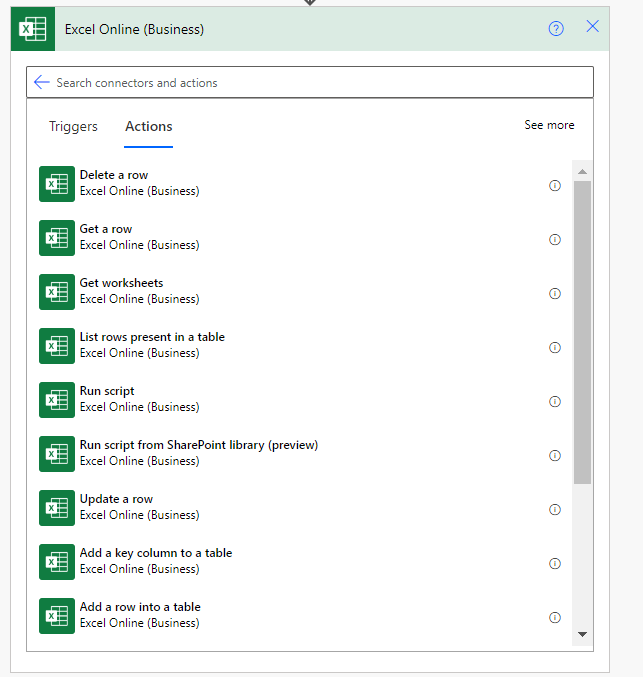
The set of actions from Excel connector includes the access to worksheets tables and ranges in the file, allowing the user to read, insert, edit or delete data from that. A lot of these actions are related to table entities, and they are usually easy to work with in comparison to the actions that manipulate ranges.
Working with Excel Tables in Power Automate
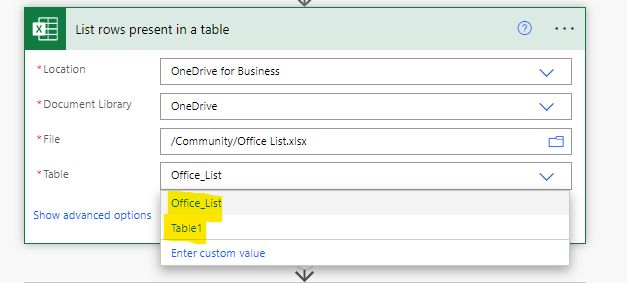
To access tables in Excel from Power Automate, you usually need to input (1) the location of the file where the table is stored, and (2) the table id (a unique identifier). For most part of the cases, you do not need to worry with the table id, as you will be able to select the desired table in a dropdown from your Excel action (highlighted in yellow):
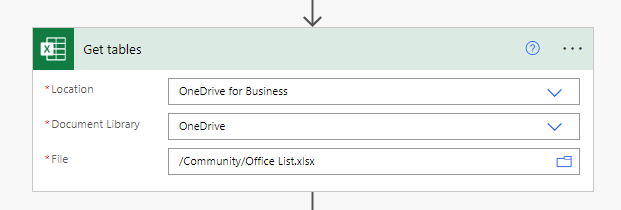
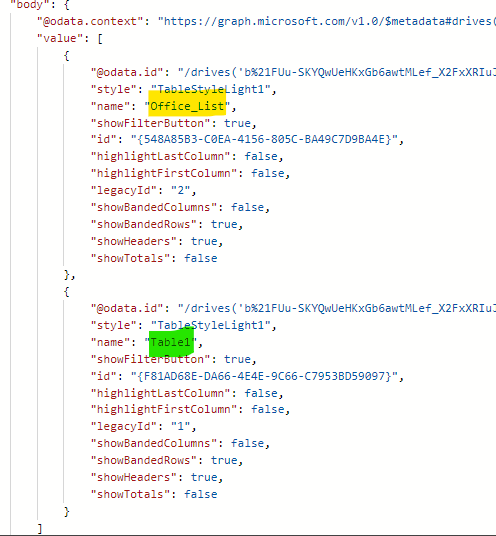
One of the possible actions is the ‘Get tables’. This is a very useful action when you do not have the Table reference during the flow building process (for example, a flow that will access an Excel file that will be created in the future, and which will have a table called “Name”). With ‘Get tables’, you can list all tables that exists in an Excel file (in this case, the same file from the image above):
Power Automate will return some details about the table (if it contains headers, which style is being used, if the table has a total row, and others), and the ‘table id’ which can be used in future actions of the Power Automate flow. When accessing the raw outputs (if you don’t know how to do it, check this post), we receive the following details:
Basically, all actions related to Excel tables will have a similar behavior: they will ask for the file location, the table name (where you can pass the result from a ‘Get tables’ output, if needed).
Conclusion
By converting a traditional cell-based layout into a structured table, users gain access to a range of benefits, such as improved organization, easier sorting and filtering, enhanced data analysis capabilities and an easier connection with other tools. When integrating Excel with Power Automate, the user will be able to interact with hundreds of other solutions, allowing it to read data from Excel or writing into it.
As almost every business has departments that work with Excel Spreadsheets, this integration with Power Automate may be very helpful to provide more efficiency and accuracy for a large set of processes.
