
As a low code solution, Power Automate is great for business process automation, empowering organizations to streamline their workflows and automate tasks seamlessly. When using the tool, we sometimes receive error messages that are not clear and we get stuck about how to solve some problems.
However, there is a very useful feature that allow us to troubleshoot the errors in an easier way. We are talking about the outputs in JSON format, which allow users to extract and manipulate data within their workflows. In this article, we will learn how to access the outputs and how to identify the “body” inside it, which usually is the most relevant part of the outputs to troubleshoot errors.
What is JSON?
JSON, short for JavaScript Object Notation, is a lightweight data interchange format that is easy for both humans and machines to read and write. It has the same goal from XML and CSV formats: it can be used by many softwares and tools. As an example, a same JSON file can be opened (and easily read, if correctly structured) in Microsoft Excel, in a Python Code or in a Mobile Application. When you access your online banking or like a post on LinkedIn, there is a very high chance that at least one JSON file is being manipulated in the backend.
The JSON provides a standardized structure for representing data as key-value pairs and collections. In Power Automate, JSON is commonly used to represent the outputs generated by actions, connectors, and expressions. Also, the variables of object data type in Power Automate follow the same JSON syntax, so you will probably be comfortable with the raw outputs if you ever used objects in the past (for more details about how to work with object variables, refer to this article).
Accessing the flow details in Power Automate
For every flow run in Power Automate, you can access its details. There you will be able to visualize the time to run each action, the status (failed, successful, skipped) of each action, and of course, access its inputs and outputs.
In the left sidebar from your Power Automate environment, navigate to “My Flows”.
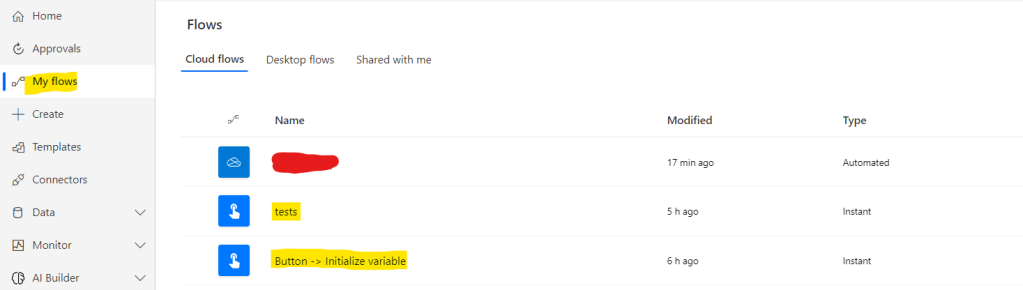
There you will be able to see all your existing flow, and if you click on the name of any of them, you will access its details:
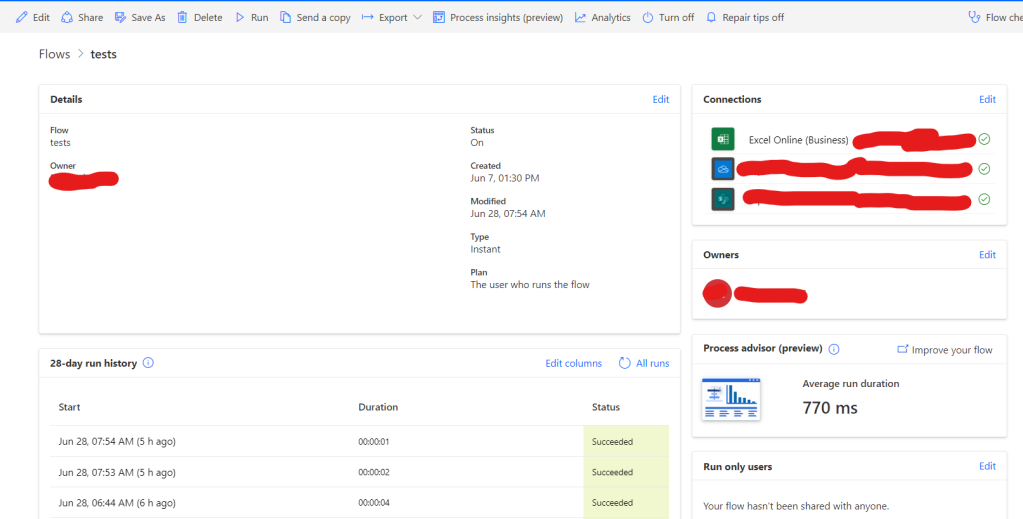
In the flow details page, you will have access to additional data about the flow, the connections currently in use, the history of flow runs, and others. For this post purposes, the most relevant information is the “28-day run history” section, which contains a list of the recent runs from your flow. If you click in the date/time of any list record you will be able to access the flow run details:
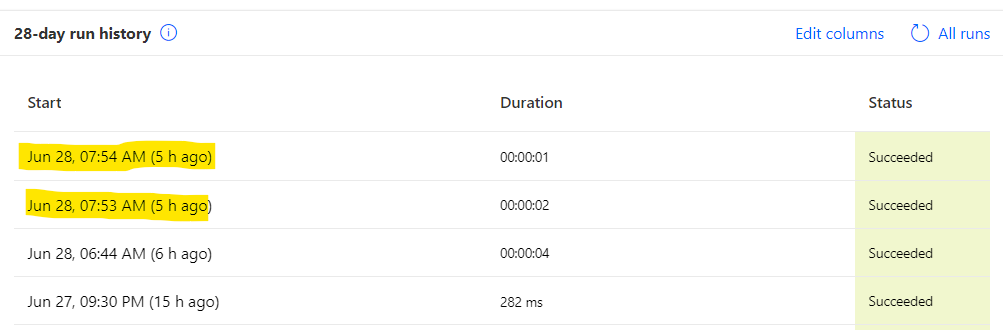
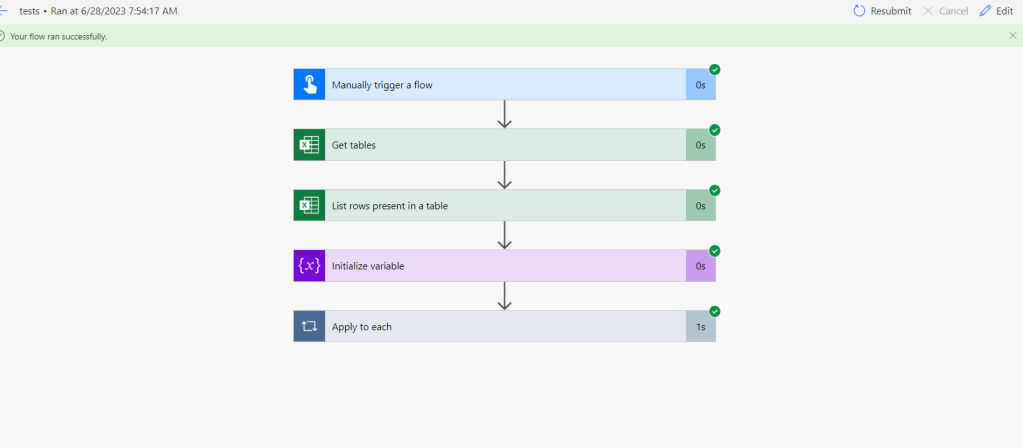
The flow run view presents a summary of that specific run, listing the actions and its status:
Raw outputs in Power Automate
If you click in any of these actions, a section will be expanded, bringing a summary of its input (highlighted in yellow) and the output (highlighted in green) in a user-friendly layout. But the data that we need is more detailed, so we can access it by clicking in “Show raw outputs” (highlighted in blue):
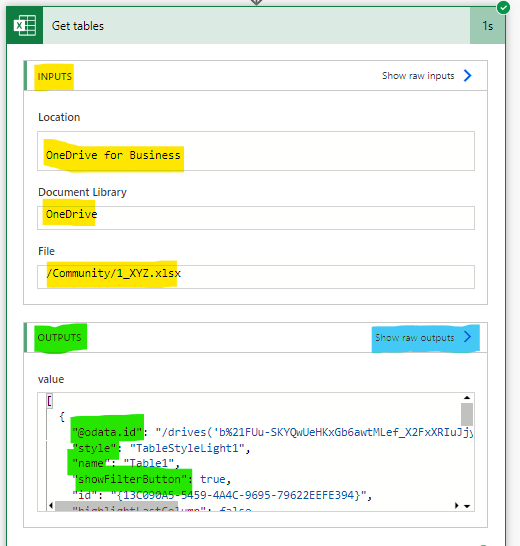
A new sidebar will appear on the right side of screen, containing a lot of weird data that seems to be impossible for understanding by humans. But don’t worry: at most part of the cases, you can ignore this illegible part. For troubleshooting purposes, you must focus in the “body” of your output (highlighted in blue in the image below).
As an example, from the body we can extract that the property value (highlighted in yellow) is listing data about tables allocated in a specific Excel file, from where we can extract the “table name” for example (highlighted in red):
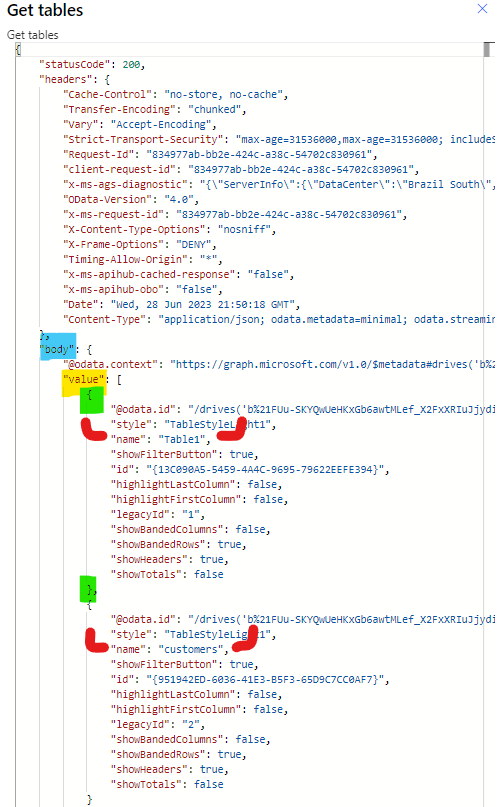
For this specific action output, the data from each table is allocated between “{}”, and there you can find details about the table headers (“showHedaers” property), the table total row (“showTotals” property), the existence of a filter button on the table (“showFilterButton”), and others. These properties vary according to the action that you are analysing: an output from a ‘Get file details’ from SharePoint connector may looks very different from a ‘Send email’ action from Outlook connector.
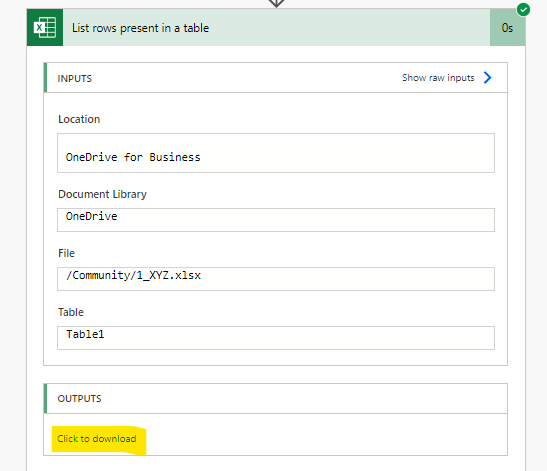
In some cases, your outputs may be too big to be displayed in a side bar, so Power Automate will show a “Click to download” link instead of “Show raw outputs”, like in this other action from the same flow:
The outputs will be presented in a separated tab (depending on your browser configuration, the outputs in a new tab may be unformatted):
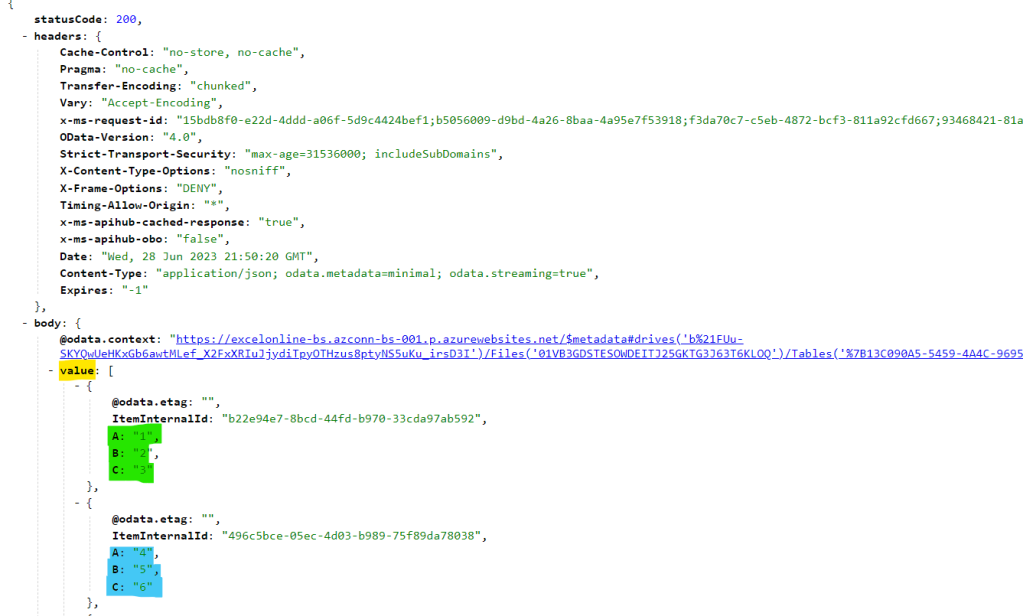
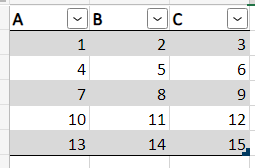
By the way, the output of this action is very different from the ‘Get tables’ one: instead of bring details about each table, it returns data about each row from a table in Excel file. This output represents the data allocated in the table below: the first row is highlighted in green and the second row is highlighted in blue. So the outputs represent the values inserted in a table, referencing to both rows and columns.
Conclusion
By accessing your outputs details in Power Automate, you can get much more information about what data your actions are carrying, and use it to improve your flow design. Also, some errors can be identified by reading and understanding the structure of the outputs, like the incorrect uses of data types or, for more advanced purposes, the identification of the JSON structure of the output.
